Assessing the streaming opportunity: You’re doing it wrong

9 Apr 2021
Buoyed by lockdown, streaming enjoyed another strong year in 2020, up 17.1% on 2019 according to MIDiA’s recorded music market shares report. But the revenue slowdown will come in 2021, driven by the maturation of the big music markets (e.g. US, UK, Australia) and the growth of emerging markets. Identifying emerging markets growth as a slowdown factor might sound oxymoronic but the lower ARPU in these markets means that subscriber growth and revenue growth are becoming uncoupled. Look no further than Spotify’s earnings: subscribers were up 25% in 2020 but premium revenue was up just 17%, driven by a premium ARPU decline of -9%. Despite the dampening effect of emerging markets, they will be crucial to future growth – yet much of their potential may go untapped. The reason is all to do with how the music industry measures the opportunity, and that approach needs to change.
Anyone who has seen, or prepared, an investor presentation will be familiar with the total addressable market (TAM) concept. It is the big number that is used to impress investors with just how big the market opportunity is. The framework is also widely used in the music business to illustrate how much growth remains for streaming. But it only tells part of the story, and crucially it can be highly misleading – especially so for the streaming music market.
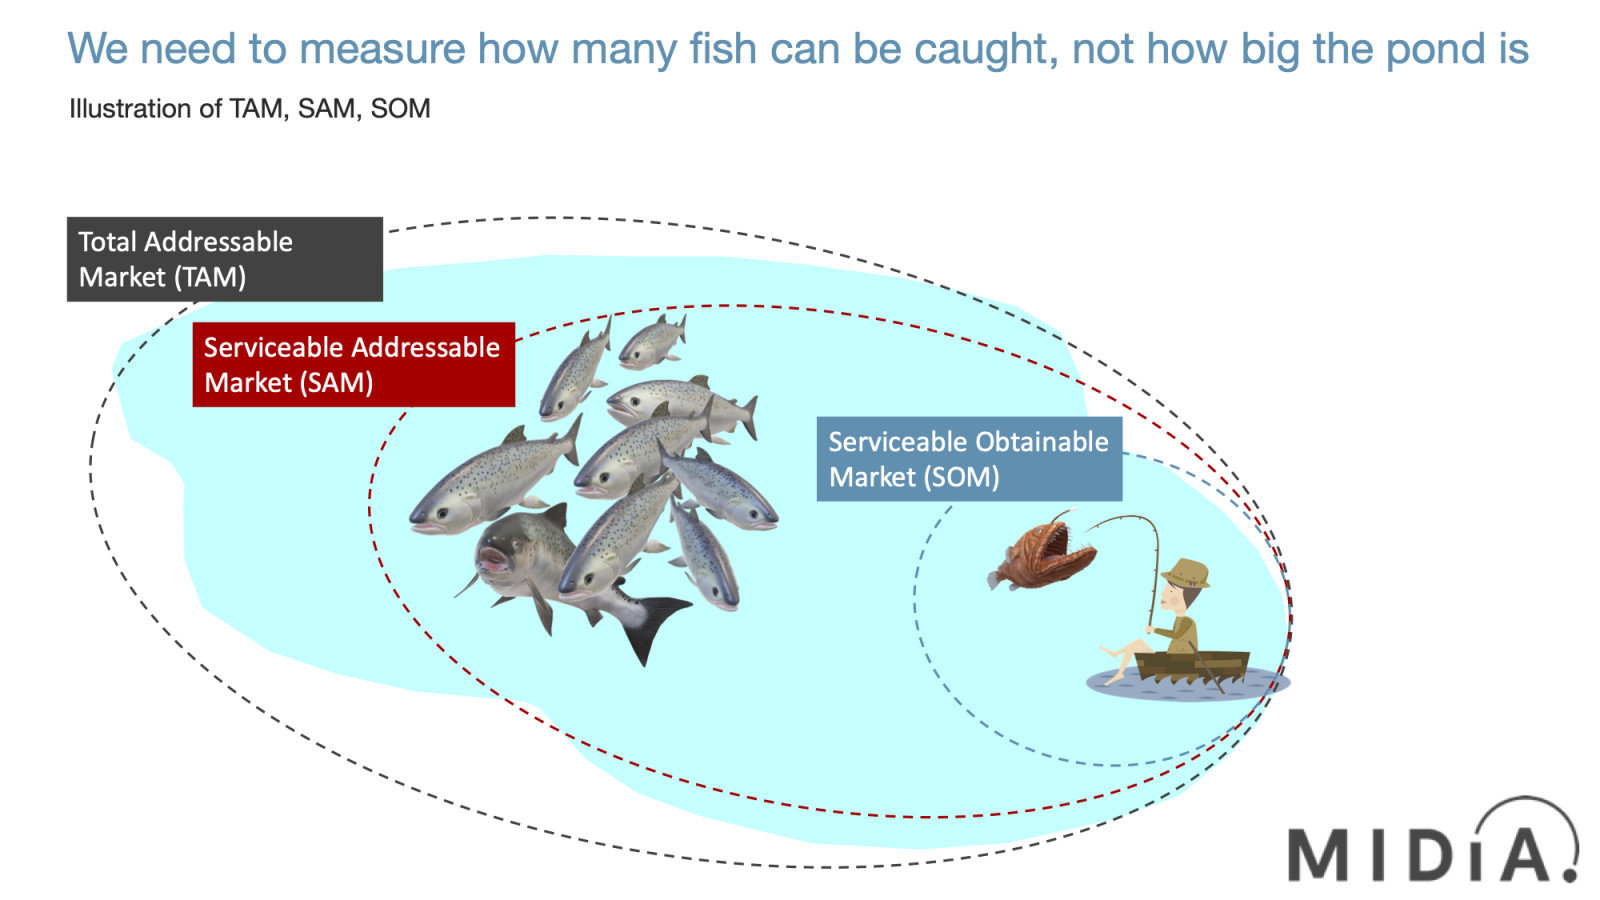
When MIDiA works on market opportunity projects for clients we always take the next two steps in the TAM approach: serviceable addressable market (SAM) and serviceable obtainable market (SOM). Here’s how it works:
· TAM is how big the pond you are fishing in is
· SAM is how many fish there are in the pond
· SOM is how many fish you are likely to catch
TAM: you’re doing it wrong
The obsession with the TAM can be problematic because, while it results in impressive-sounding numbers, it is not a useful measure for understanding what a company or sector can actually do. If you are one person fishing in a lake, it does not matter how big the lake is nor how many fish there are; you and your fishing rod can only catch so many fish. When Spotify announced its extra 85 markets in February it said it was bringing its service to ‘more than a billion people’. That might give the impression of representing massive future growth, but it is simply the TAM. In fact, the figure is more than the TAM because only a sub-component of that one billion have mobile data plans – the industry’s principal TAM measure. In order to understand where the streaming market can really go, we need to go deeper and lay out the SAM and SOM.
The SAM and SOM layers are even more important for emerging markets than developed markets. There is a tendency to assume that because most people listen to music in some way or another, they are all addressable by music. But this is not the case. Most people, at least in developed markets, read – but that does not mean they all buy books, magazines or newspapers. The same applies for music.
Featured Report
Splice x MIDiA Sounds of 2026 House on the rise
We zoom in on the trends and microtrends driven by the music industry’s biggest fans and most influential tastemakers: creators. Turn page after page of trends unfolding in real-time and see how Splice’s dataset is the barometer for the state of music today.
Find out more…Going beyond the TAM hype
In order to get beyond the TAM hype, MIDiA is building a new TAM, SAM, SOM model for music and we are for the first time going to use it to drive our forecasts (we have previously used a weighted scorecard methodology). One of the key reasons for the shift is to better understand just how much, or little, opportunity can be tapped in emerging markets with currency pricing strategies. Although subscriptions are much cheaper in emerging markets in dollar terms, when they are looked at in affordability terms, a very different picture emerges. Take India: the average headline cost of a subscription is just 15% of what it costs in the US. But when looked at on a purchasing power parity (PPP) basis (i.e. a measure of relative affordability) it is five times more expensive. Therefore in India, one of the world’s lower per-capita GDP markets, music streaming has been priced for the well-off, urban elites. And that is fine, as there are plenty of them. But it means that streaming subscriptions are out of reach for the majority of the population, which means that it is irrelevant to refer to India’s 1.4 billion people when talking about the opportunity, unless prices are reduced by a fifth – something music rights holders, at least Western ones, are currently loathe to do.
To better determine the market opportunity, MIDiA is using the following approach:
· TAM: A hybrid measure of people with smartphones and data plans (including assessing the ratios between them)
· SAM: The share of the TAM that is interested to some degree in paying for music
· SOM: The SAM with additional discounts for factors such as a PPP measure of streaming pricing and urbanisation rates
Although this approach results in much smaller end figures, it is a much more useful way of understanding where music subscriptions are likely to get to in the next five to ten years. It also helps us better segment the emerging market opportunity, with some regions, such as the Middle East and North Africa, coming out much stronger – in large part because of better affordability in relation to per-capita GDP.
I appreciate we are giving away some of MIDiA’s ‘secret sauce’ here, but we think that this is such an important issue that we want to highlight it to as many people as possible. If your research provider (internal or external) is providing you with TAM figures to assess the market opportunity, then they are simultaneously under-selling you and over-selling the market opportunity.
Want the latest entertainment research and insights directly to your inbox? Our newsletter has you covered, click here to subscribe.
There are comments on this post join the discussion.