MIDiA Chart Of The Week: Mobile App Buyers

78% of mobile app revenue is concentrated in 26% of app buyers with the majority of that revenue driven by in-app purchases. These ‘whales’ are the beating heart of the mobile app economy but their small number means that they make precarious foundations for the market. In a similar manner to the music industry, a large part of total revenue is driven by a small number of super-fans, while the vast majority of mainstream consumers remain free users:
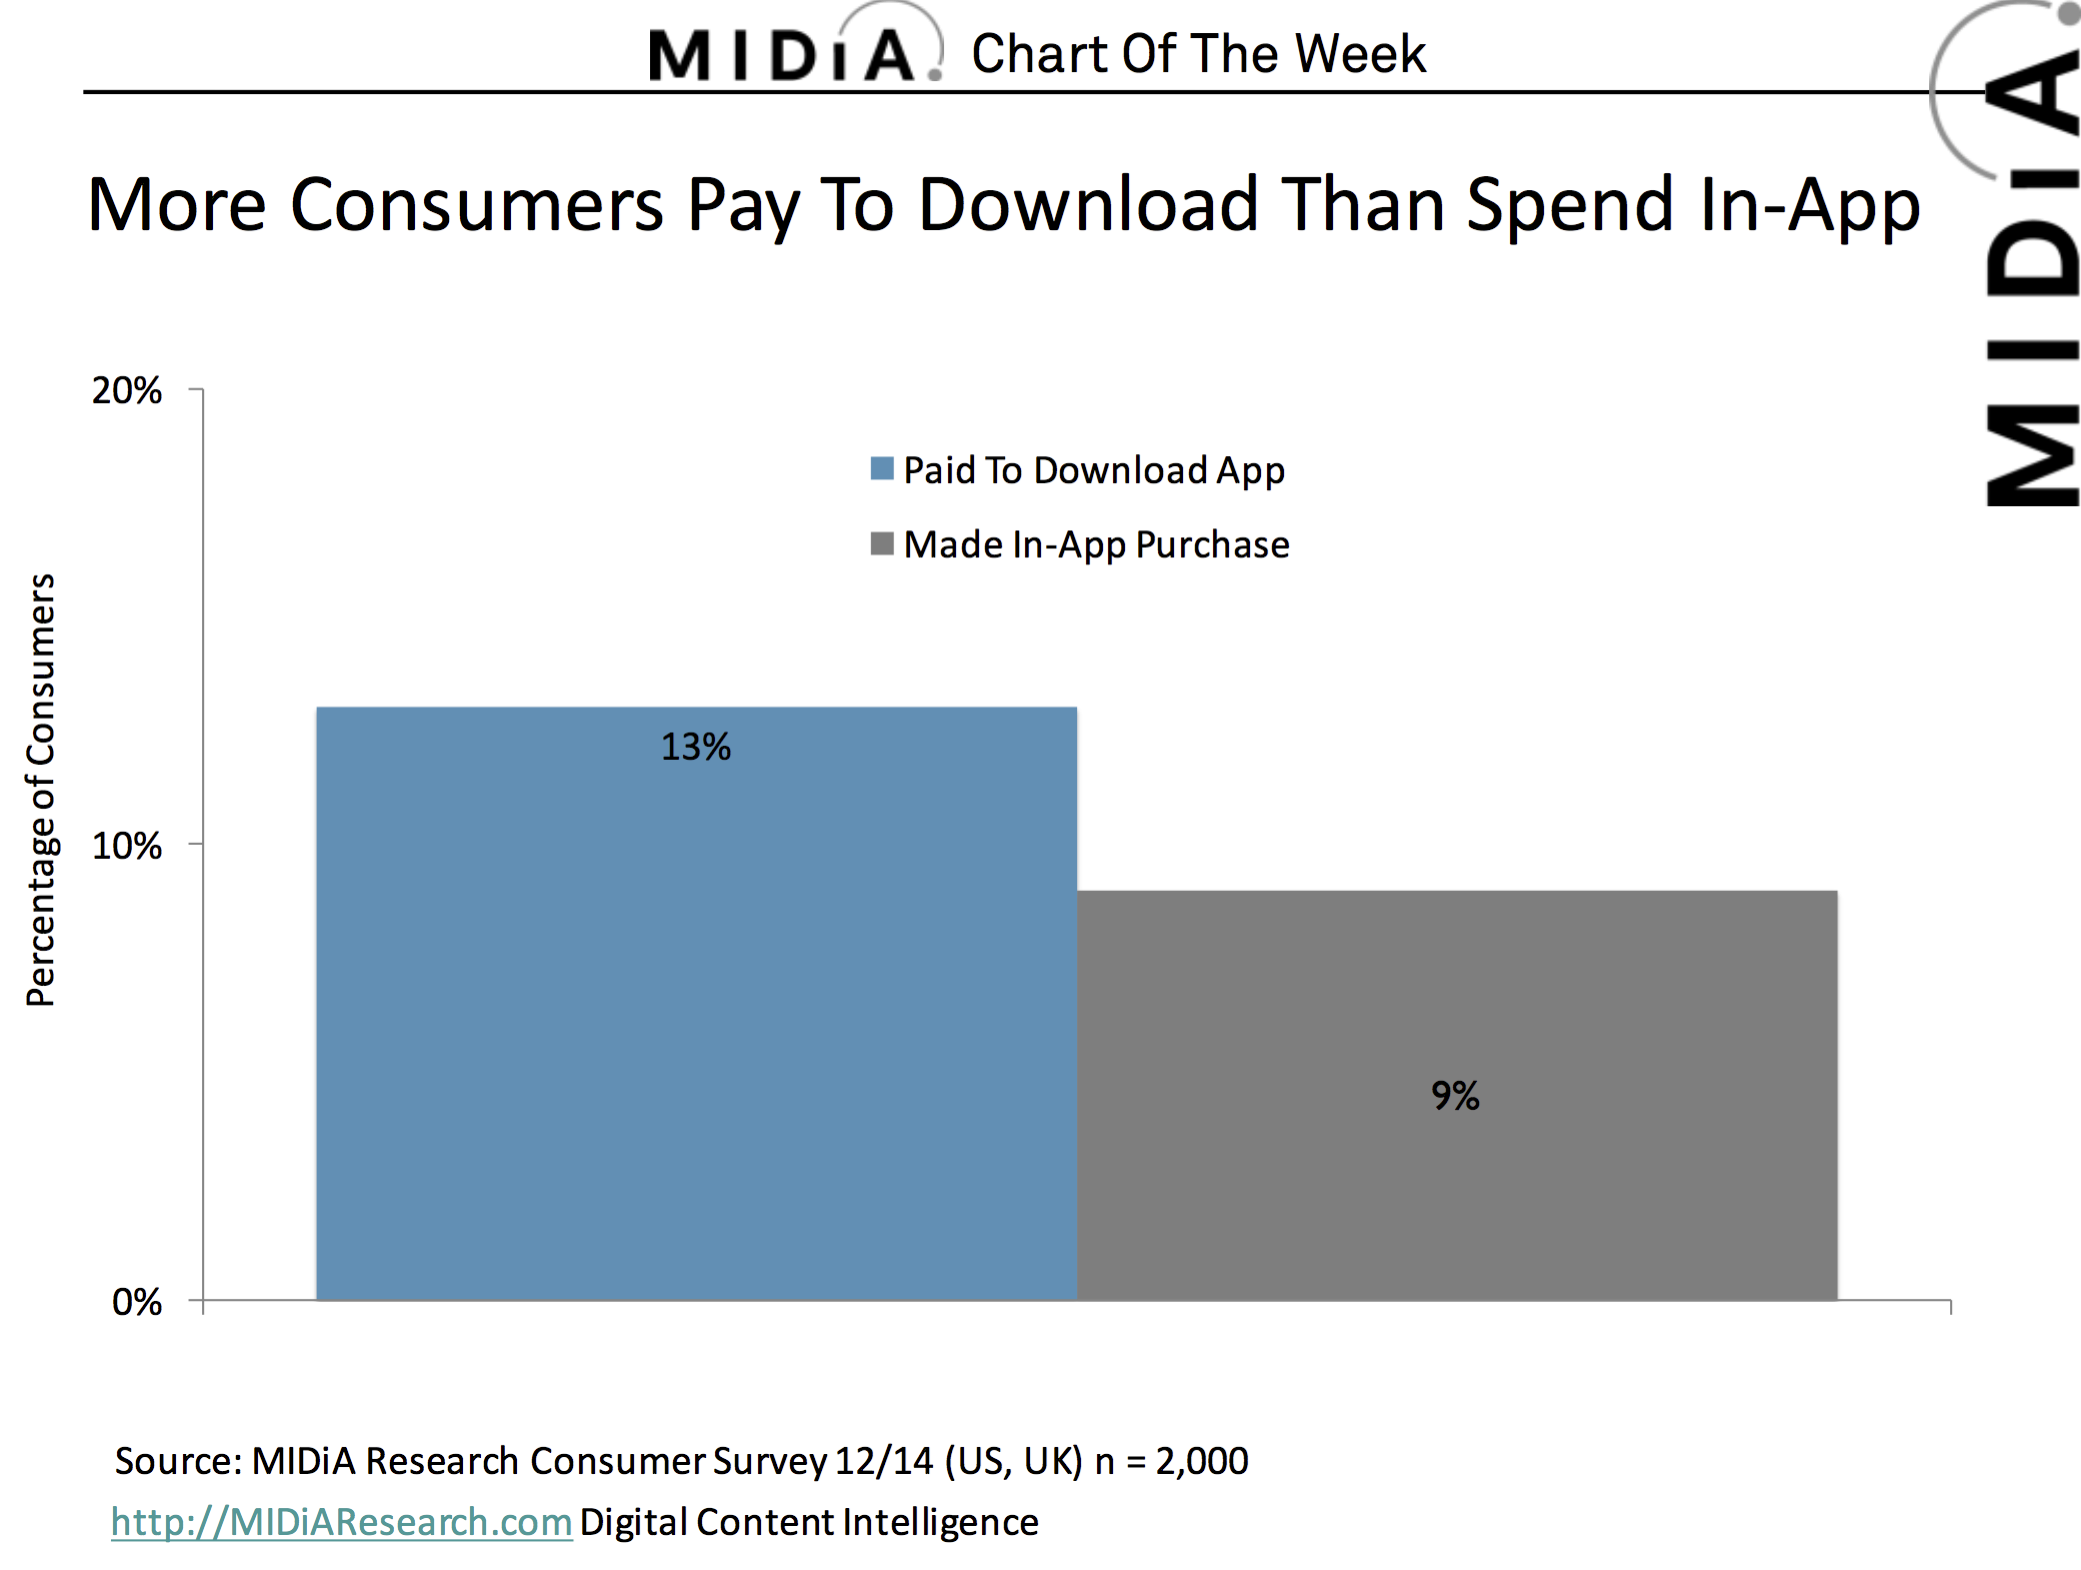
- Paid app downloaders outnumber in app buyers: Despite larger revenues from in-app purchases, approximately 50% more people actually paid to download an app than paid for an in-app payment. While the size of the gap varies significantly across age groups, paid downloads are ahead of IAP in every age group. Both Android and iOS have more download payers than IAP. But while the share of IAP penetration is equal on both platforms, iOS leads in terms of paid downloads by 28%.
- Developers focus on the preferences of a minority: Focusing on the needs of the 26% makes commercial sense but it is fraught with risk. The needs of app payers differ from those of non-spenders and neglecting the latter group is risky. Games that rely heavily on their user base for social interaction or co-operative play are the most exposed. If the preferences of paid users entirely subvert those of non-spending gamers then non-spenders will disengage, affecting the scale of the game and therefore potentially even the spenders’ gaming experience.
The discussion around this post has not yet got started, be the first to add an opinion.