Fandom Overlap – Cannibalisation risks for games and SVOD releases

October 27 was one of the busiest days in terms of major games releases in 2017. On that day, Super Mario Odyssey, Assassin’s Creed and Wolfenstein II were released, attracting gamers across the genre spectrum. Simultaneously however, another digital entertainment proposition – season two of Netflix’s original sci-fi series Stranger Things, was also released.
Traditionally, release analytics and planning are used in video and games industries to align release calendars to mitigate potential eyeball cannibalisation among competitors. Often however, the considerations of potential release clashes are limited to the company’s core vertical.
Assassin’s Creed had a relatively strong first week after all. However, the question remains: could it have had an even stronger release, had it not overlapped with the release of Stranger Things? In short, yes. MIDiA Subscription clients can read the full report here.
So what can games and video companies do to minimise the chances of eyeball cannibalisation upon release? The answer is in extending release analytics to take into account potential disruptions from releases across the entire digital entertainment sphere.
As gaming continues its journey to becoming a mainstream consumer behaviour, gaining parity with TV viewing, both industries will have to pay more attention to the other, in order to mitigate potential releases clashing.
FUSE currently tracks over 50 TV show fan segments, enabling users to learn about behavioural and attitudinal nuances of each segment in seconds. You can cross reference TV fan segments against our game fan segments (or those of TV competitors) and spot cannibalisation risks with planned releases.
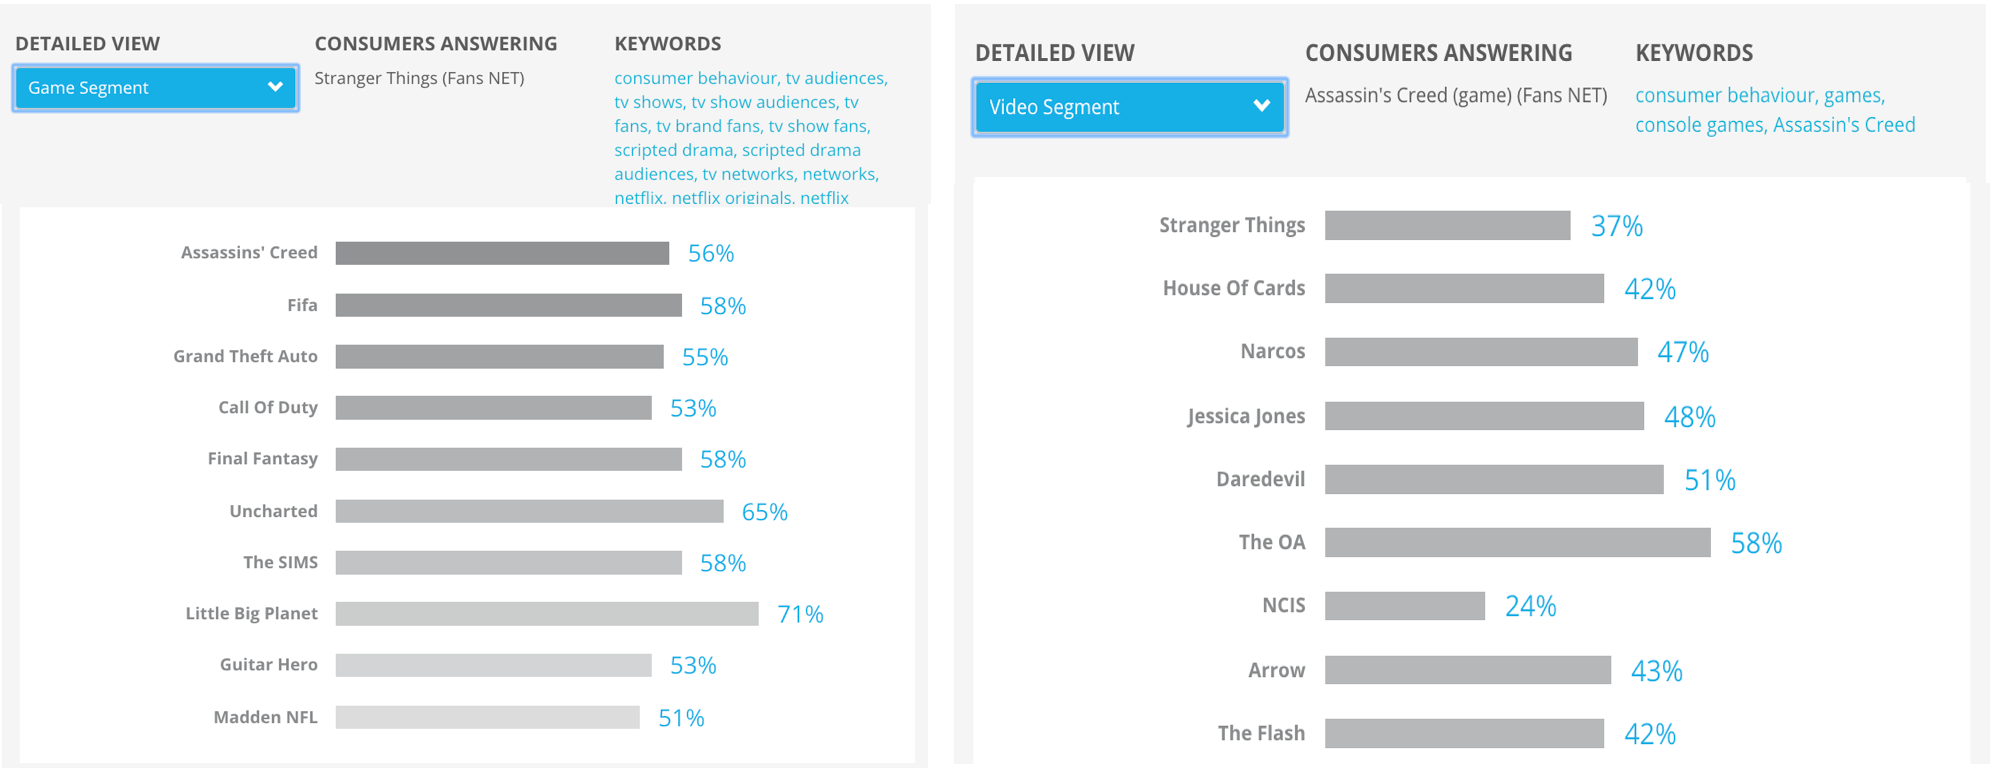
56% of Assassin’s Creed fans are also Stranger Things fans, however only 35% of Stranger Things fans are fans of Assassin’s Creed’s.

Furthermore, FUSE’s survey segment view allows users to compare digital behaviour in our segments. For example: 45% of Narcos fans use Instagram weekly, while only 33% of Big Bang Theory fans do so).
There is much more to explore within FUSE’s detailed survey segment. Here’s how to get started:
Start in Search -> Tick the ‘Consumer Survey’ data type only -> Insert TV show name (e.g. Stranger Things), or the service you are interested in (e.g. Instagram). -> Click ‘View Detail’ on the relevant search result -> You are now looking at consumer average numbers -> Click any of the blue data bars -> Select any segment from the ‘Detailed View’ to see how it answered the question you highlighted.
Happy insight gathering!
The discussion around this post has not yet got started, be the first to add an opinion.